Reducing Nitrogen Fertilizer while Maintaining Yields in Row Crops
Crops need nutrients to grow
All plants need nutrients including the macro-nutrients nitrogen, phosphorus and potassium. Without these nutrients, a seed can not grow into a healthy plant and produce grain or other fruit. Some plants, such as legumes, make their own inorganic nitrogen while others need it supplied.
Over-application has negative impacts for farm profitability and the environment
Too much nitrogen (N) can cause reduced crop quality, delay maturity, and increase risk of lodging and disease susceptibility. One reason for this is that excess N causes more growth of stalks and leaves at the expense of grain or fruit yield, e.g. corn grows taller but ears are smaller [1, 2]. In addition, N not used by the plants can easily be lost to the environment and may contribute to eutrophication of surface waters, contamination of groundwater, and emissions of nitrous oxide (N2O, a potent greenhouse gas).
Fertilizer takes energy to make – optimizing fertilizer use to meet crop needs reduces indirect energy costs
The energy needed to produce N fertilizer for an acre of corn 1 uses the same amount of energy as what 12 average homes in NYS use in a year (calculated using [3, 4])2. Urea and urea ammonium nitrate, both made from ammonia, take additional energy to produce [3].
There are many ways to reduce N-fertilizer use while maintaining yields
By following the 4 Rs, right source, right place, right time, and right rate, yields can be maintained while N-fertilizer losses are reduced.
Right source
One way is to use other sources of N: soil organic matter from the residues of legumes and high-quality grass sod, and both inorganic and organic N from manure.
Optimizing N management for crops starts with accounting for N that is already usable in the soil or available from biological sources over the growing season (for more information see Nitrogen Guidelines for Field Crops in New York). Soils contain organic matter which releases N over time. To learn more about whole-farm nutrient balances, see Agronomy Fact Sheet 85, Feasible Whole-Farm Nutrient Mass Balances.
Legume crop residues
Residues from legume crops, namely soybean and alfalfa, can provide some N through N-fixation. For more about increasing N through legume crops, see Agronomy Fact Sheet 30, Soybean N Credits and Agronomy Fact Sheet 39, Nitrogen Fixation.
Legume cover crops
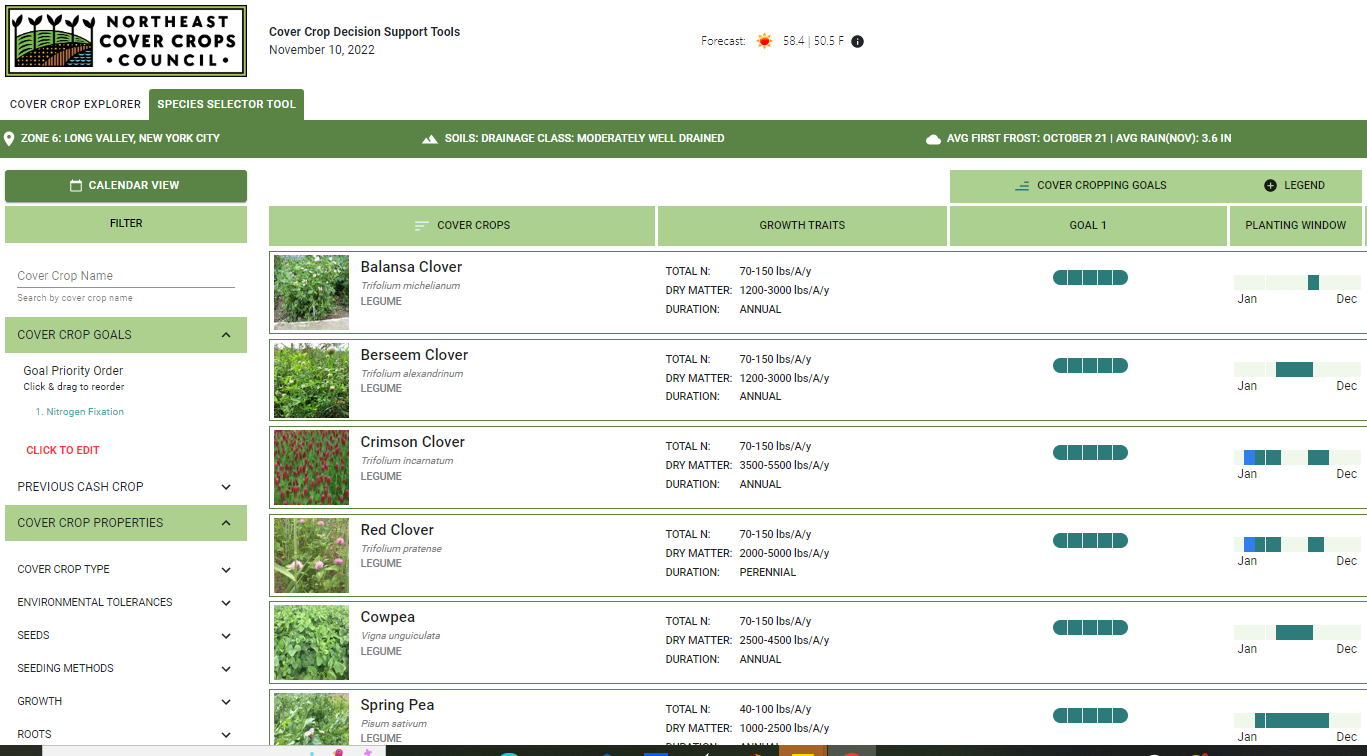
Legume cover crops can also provide N through N-fixation. Cover cropping has many aspects to consider, and you can learn more about it on the following pages and with resources like the Cover Crop Decision Support Tools (Figure 1).
Integrating Cover Crops for Nitrogen Management in Northeast Corn Systems
Agronomy Fact Sheet 60, Nitrogen Credits from Red Clover as Cover Crop between Small Grains and Corn
Agronomy Fact Sheet 116, Cover Crop Species Selection in Field Crop Systems
Figure 1: An example of some cover crop species that can be grown on a field near Ithaca, NY, with the goal of “nitrogen fixation”. This Species Selector Tool from the Northeast Cover Crops Council helps identify options giving a score of 0 (does not address the priority) to 5 (greatly addresses the priority) for each goal and each species selected.
Grass and grass-legume sods
Residues from grass and grass-legume sods can contribute nitrogen, depending on stand vigor and legume content. For considerations about how much nitrogen is needed when growing field crops, see Nitrogen Guidelines for Field Crops in New York and Agronomy Fact Sheet 21, NItrogen Needs of 1st Year Corn.
Manure
Another excellent source of nutrients is manure. Dairy farms are using manure to offset fertilizer costs while growing their feed crops and to benefit from the yield enhancing properties of manure. Other farms are partnering with dairy farms to use manure as well. Manure provides N in both inorganic and organic forms [6]. Timing and placement, as covered next in terms of N-fertilizer reduction, apply to manure as well. For more information on using manure as a source of N, explore the following resources:
Progressive Dairy, Manure – A valuable nutrient asset
Agronomy Fact Sheet 4, Nitrogen Credits from Manure
Agronomy Fact Sheet 38, Manure Sampling, Analysis and Interpretation
Agronomy Fact Sheet 61, Valuing Manure N, P, and K Applications
Agronomy Fact Sheet 67, Can Manure Replace the Need for Starter N?
Agronomy Fact Sheet 76, Manure Use for Soybeans
Agronomy Fact Sheet 87, Liquid Manure Injection
FieldCropNews, Toolbars for Manure Injection
In summary about sources
Alternatives to synthetic N fertilizer can help reduce the amounts of N fertilizer needed overall (Table 1) and offer other co-benefits as described later on this page.
Table 1. Estimated reduction of N fertilizer by source, based on grower data or recommended rates for each source. Types of soils and practices may affect these numbers. They are meant only as estimates.
| Source of N | Nitrogen Fertilizer Reduction Value |
| Cash Crop Residue (soybean) | 20-30 lbs N/acre [7] |
|
Legume Cover Crop Fall planted Vetch Yellow Sweet Clover Spring planted Red clover |
0-235 lbs N/acre (most 50-100 lbs N/acre) [8] 17-149 lbs N/acre [8] 56-112 lbs N/acre [8]
70-120 lbs N/acre [9] |
| Sods | 50-90 lbs N/acre (depending on stand vigor and legume content) [10] |
|
Manure Ammonium-N Organic-N |
[11, 12 example within; manures vary widely] 3 130 lbs N/acre (if injected or incorporated within 24 hrs) 72 lbs N/acre (N becomes available over 3 years [6]) |
Once you have taken into account all of the N available in the soil and from manure and crop residues, you can optimize utilization of N- fertilizer by applying it to match crop growth through a change in timing, placement (method of application and variable rate application), and/or the use of models.
Crop growth can vary over both time and space and depends not just on available N, but also on soil, temperature and precipitation. Cool, moist climates like that in New York make nitrogen in the form of nitrates in the soil prone to leaching out of the soil (for a summary of the nitrogen cycle, see Agronomy Fact Sheet #2). Applying N at the right time, with the right source, rate, and place will reduce the risk of losing N.
Right timing
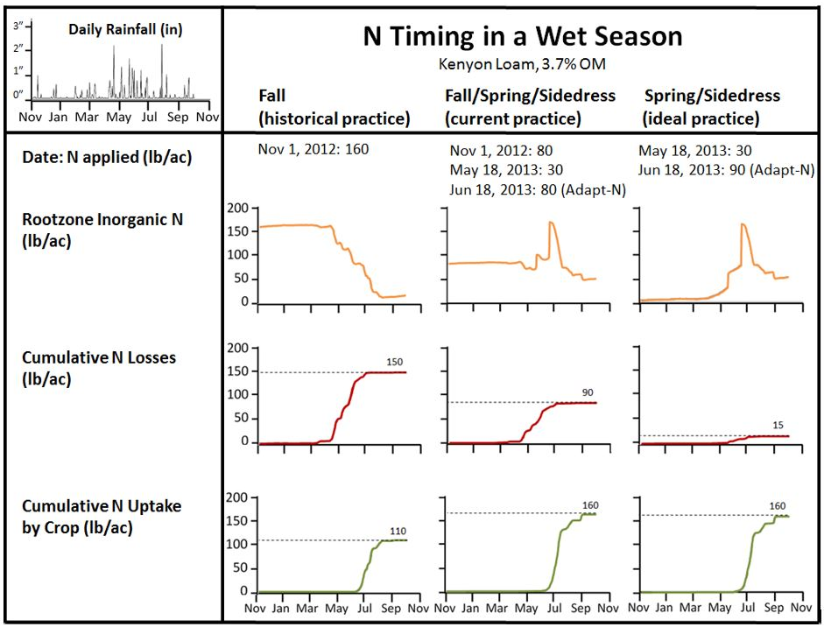
Crop uptake of N is generally low at the beginning of the crop’s growth, but increases greatly during times of rapid vegetative growth and grain filling, with the greatest rate during vegetative growth before reproduction [13]. Therefore, losses can be minimized if N is split-applied with a small amount as starter fertilizer applied at planting, followed by additional N as side-dress application (in-season) [14].

Figure 2. Adapt-N “what-if” simulation of three N-timing practices (fall only; fall/spring/sidedress; and spring/sidedress) in a wet season. Adapt-N recommendations in this simulation would have minimized N losses and required less total N for an equivelent yield. Figure taken from Cornell Field Crops, Farmers with Diverse Nitrogen Management Practices.
For additional information on timing and crop uptake of fertilizer applications, explore the following resources:
Agronomy Fact Sheet 98, Nitrogen Uptake by Corn
Agronomy Fact Sheet 3, Pre-sidedress Nitrate Test
Agronomy Fact Sheet 36, Illinois Soil Nitrogen Test (ISNT)
Nutrient Management Competency Area 3: Soil Testing and Plant Tissue Analysis (Go to PO22-PO24)
Agronomy Fact Sheet 65, Fertility Management of Winter Wheat
Agronomy Fact Sheet 45, Enhanced-Efficiency Nitrogen Sources
Right rate in the right place
Method of application
High nutrient uptake efficiencies can be obtained by applying the starter N fertilizer through banding, where the fertilizer is applied in shallow furrows several inches from the seed, and then sidedressing it in-season. These reduce the risk of loss to runoff and volatilization [15].
Variable Rate Application (VRA)
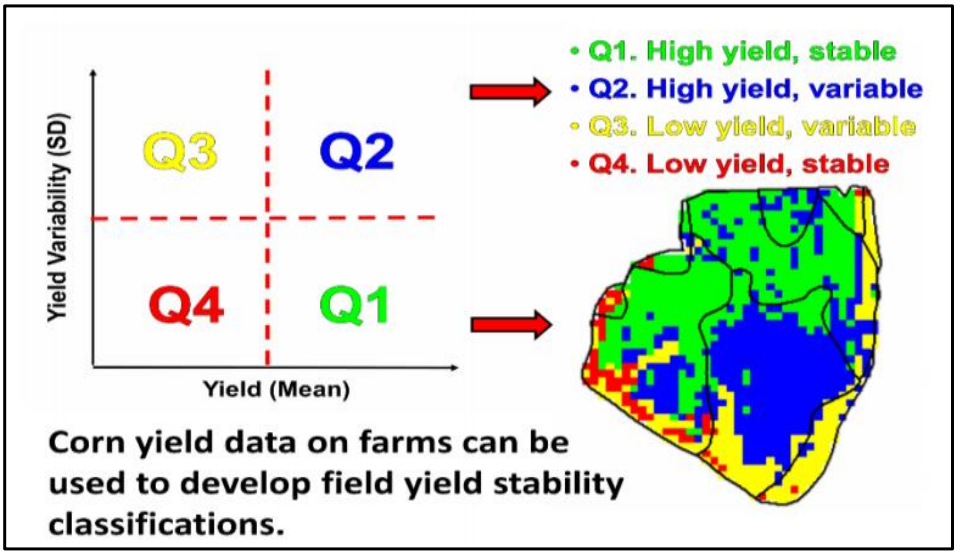
Are some areas of your fields more productive than others (as in Figure 3 below)? If so, it makes sense to provide more fertilizer to those areas where it will help you get the greatest yields and less to where N is not the limiting factor. By dividing your fields into management zones [16], future advances in fertilizer management can be made.
Additionally, according to Cornell Cooperative Extension Fact Sheet #108 on In-Field Zone Management of Field Crops, “Once zones are established within fields, crop needs can be evaluated per zone. Furthermore, zones can highlight field characteristics that might indicate the need for change in large-scale management practices such as crop selection, land use, or increased drainage, or smaller-scale practices like variety selection, seeding rates, and lime, manure, or fertilizer applications.” [16] Contact your local extension office for support on developing management zones (you can look up your local office on https://cals.cornell.edu/cornell-cooperative-extension/local-offices).

Figure 3. Using at least three years of historical yield data, yield stability zones can be created using whole-farm average crop yield and standard deviation of crop yield over time to create management zones. Figure taken from Agronomy Fact Sheet 108, In-Field Zone Management of Field Crops.
Nitrogen application rates can be varied according to the N needs within management zones. The N needs can be determined in several ways.
Determining N rates using tests for nitrogen.
This type of testing is most beneficial as part of adaptive management. If you are growing corn, a baseline for each management zone is your current target N rate or that given by the Cornell N equation for corn [17,18]. You can then use the corn stalk nitrate test post-harvest and the Illinois Soil Nitrogen Test in the fall before any manure is applied. The two tests together will provide the information needed to determine the minimum amount of N fertilizer to apply that will still give optimal yields especially if they are repeated every few years [17, 19, 20].
To apply the right amount of fertilizer to the appropriate management zone, you can program field prescriptions into your application equipment [16].
For more information on appropriate nitrogen application rates, explore the resources below:
Nitrogen Guidelines for Field Crops in New York
Agronomy Fact Sheet 36, Illinois Soil Nitrogen Test (ISNT)
Agronomy Fact Sheet 31, Corn Stalk Nitrate Test (CSNT)
Agronomy Fact Sheet 63, Fine-Tuning Nitrogen Use on Corn
Agronomy Fact Sheet 3, Pre-sidedress Nitrate Test
Active sensors
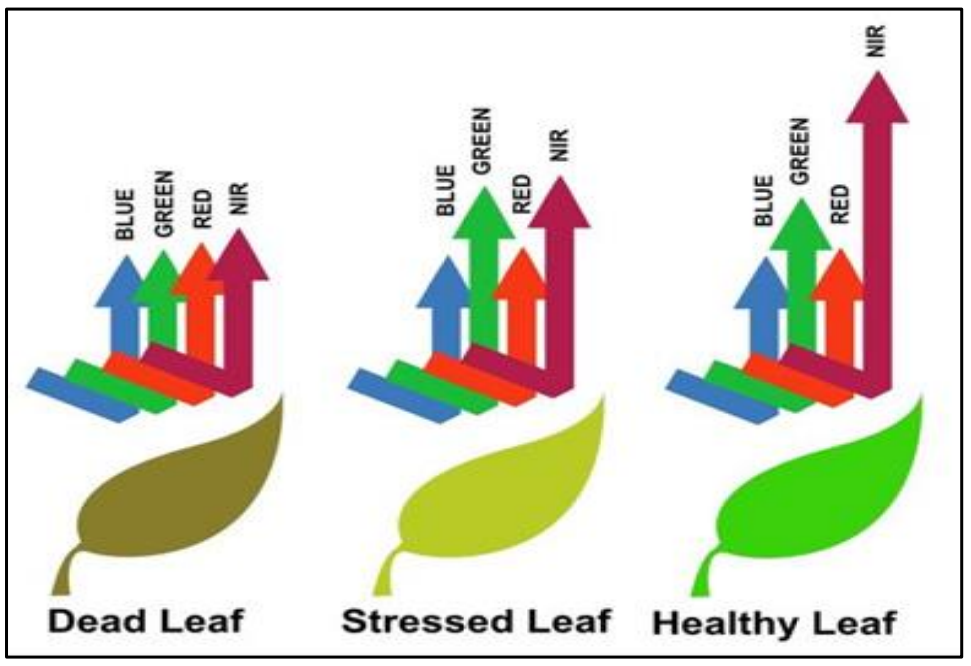
Another way to figure out if N rates should be adjusted is to use sensors that generate NDVI maps. The right types of sensors can assess differences in crop vigor across a field based on differences in light absorption and reflection of leaves (Figure 4). An N-rich strip is required to calibrate the sensor readings, so that the index can distinguish N-stress from other forms of crop stress (if plants in the N-rich strip are stressed, you will know that it isn’t because of too little nitrogen) [21, 22]. Talk with your local Technical Service Provider to see if additional strips are advisable [22] (you can find your local extension office at https://cals.cornell.edu/cornell-cooperative-extension/local-offices).

Figure 4. Light absorption and reflection of leaves (source: www.zelmaerospace.com/precision-ag). Figure taken from Agronomy Fact Sheet 103, Multispectral Active and Passive Sensors in Agriculture.
If sensor technology is too expensive, there are simple low-tech ways to achieve similar results. Instead of sensors, a farmer can look at crop greenness or the amount of growth (biomass) and compare it with small reference plots or strips with varying rates of N. Observations of crop vigor in reference plots as compared with crops in the field can indicate what level of N is sufficient and what is in excess of what the crop can utilize. In wheat trials, this method was shown to maintain yields while reducing N rate by at least 36 lbs per acre (as compared to 53 lbs per acre reductions from sensor-based assessments) relative to baseline practices. This shows that significant reduction in N rate is able to be achieved by all farms, regardless of size or equipment investment. For more information about that, see FAST-GHG documentation, Overall Methods, Appendix F, 3.3.1 Observed benefits of N fertilizer optimization techniques.
Models
Several models have been made available to determine N rates for corn, including Adapt-N [23], Maize-N [24], and EPIC [25]. Data that go into the models’ calculations may include tillage, crop and cover crop residue management, basic soil properties, fertilizer management, and manure management.
The greatest strength of these tools is their use of real-time weather data [23, 24]. In particular, precipitation data allows both the calculation of loss of N before sidedress due to wetness, and the reduction in growth potential due to dryness. Farmers have long included “insurance” fertilizer to make sure there is enough for the crop.
There may also be a Variable Rate Application (VRA) component to N-fertilizer modeling tools [23, 25].
To read more about the use of models in optimizing N-fertilizer application, see the following resources:
Field- and Season-Specific N Rate Recommendation for Corn Using Maize-N Program
University of Nebraska-Lincoln Maize-N
EPIC as used to determine N fertilizer recommendations
Switching to a small amount of N fertilizer in early spring (preplant or with planting) and using variable rate application can allow large reductions in the total amount of N fertilizer used (see Figure 2 and Table 2).
Table 2. Estimated reduction of N fertilizer from grower rates by practice.
| Corn | Wheat | |
| Timing |
Fall to Spring: 0-50% [Welch et al.] 4 |
17% [26] Using MAP or DAP only in Fall + normal Spring sidedress instead of additional Fall N + normal Spring sidedress in winter wheat |
|
VRA (Sensor-based) |
7%-27% [27] | 2%-35% [27] |
| Model (Adapt-N) | Reduction in N sidedress rate assuming no fall application and only small starter with no change in yield: 22%-46% [23] | N/A |
A good summary of much that has been discussed above can be found in Maximize fertilizer use efficiency for peak fertilizer prices in 2022 in ProDairy’s The Manager.
Co-benefits
Reducing nitrogen fertilizer use does more than just save energy.
Resilience to volatile weather
Manure and cover crops contribute organic matter which can benefit soil structure and increase soil health. These increase the soil’s ability to infiltrate water when there is too much and hold water when there is too little. In this way, healthy soils are more resilient in the face of volatile weather [28].
Improved environmental outcomes
New York is fortunate to have enough rain, but rain and melting snow can leach nitrates out of the soil and into bodies of water, impacting water quality and greenhouse gas emissions. In the presence of high nitrate levels, moderate amounts of water in the soil increase the risk of nitrous oxide emissions [29].
Water quality
“Harmful Algal Blooms (HABs) in freshwater generally consist of cyanobacteria (also referred to as blue-green algae). Cyanobacteria are naturally present in low numbers in most marine and freshwater systems but under certain conditions, particularly high nutrients and warm temperatures, the organisms can begin to multiply rapidly and form blooms. Several types of cyanobacteria have the potential to produce toxins and other harmful compounds that can pose a health risk to people and animals through ingestion, skin contact, or inhalation.” [30] Both fertilizer and manure, when applied in excess or at times when the crop does not need them, can result in leaching and runoff of nitrogen and phosphorus. They are one source of nutrients. Nutrient reduction strategies have been identified as the most effective approach for reducing HABs in NY. You can calculate the Nitrate Leaching Index for your soil types and precipitation levels [31].
Reduction of greenhouse gas emissions
There are several ways in which nitrates, which are good for crops, become nitrous oxide, a potent greenhouse gas, in the soil. Cornell researchers have developed a tool, the FAST-GHG calculator, to help farmers see how much greenhouse gas is typically emitted growing corn, wheat, or soybean, and by how much these can be reduced by the practices described on this page. Reducing emissions saves money and helps NYS reach its goal of reducing overall emissions by 40% below 1990 levels by 2030 and by 85% by 2050 [32]. For more information, see Agronomy Fact Sheet 119, Farm Greenhouse Gas (GHG) Inventory.
Funding opportunities
In addition to farm energy-related funding opportunities on our Incentives and Grants page, here are some funding opportunities for N-fertilizer efficiency:
- Natural Resource Conservation Service (NRCS) grants. Several types of NRCS grants are available to help farmers transition to practices covered on this page, namely cover crops and nutrient management. That includes the Environmental Quality Incentives Program (EQIP), Conservation Stewardship Program (CSP), and Regional Conservation Partnership Program (RCPP). If interested, contact your local NRCS office [33 scroll down to bottom of page].
- The New York State Soil and Water Conservation Committee provides funding through Agricultural Nonpoint Source Abatement and Control grants for using accurate estimates of crop nutrient needs, nutrient credits in soil and manure, and nutrient credits from crop residues; and Climate Resilient Farming Program grants to plant cover crops in Track 3 – Healthy Soils NY: soil health practices sequester carbon and increase resiliency to the impacts of climate change [34]. If interested, contact your county’s Soil and Water Conservation District.
- The Upper Susquehanna Coalition Cover Crop Implementation Project, funded by USC and NYS DEC through Soil and Water Conservation, provides money yearly. “The USC will utilize multiple strategies to increase implementation, including: the purchase of seed to provide to SWCD’s to support their existing cover cropping programs, incentivize producers to implement cover crops, and contracting with private contractors to cover the costs of cover crop implementation.”
- Cornell PRO-DAIRY’S Dairy Advancement Program provides funds for environmental planning through the development and implementation of comprehensive nutrient management plans (CNMPs) and engineering of best management practices identified in the farm CNMP as well as the addition of funds to install new non-contact cooling water reclamation systems, facilitating the continued excellence in environmental stewardship on New York’s dairy farms.
- A pilot Payment for Ecosystem Services program for New York State is starting in Tompkins County. Stand by for possible financial incentives for managing farms for soil and water health in New York [35].
Summary
There are a number of ways you can reduce your N-fertilizer use. These include using alternative sources of N such as manure and legume cover crops; or practices that apply N-fertilizer when and where it matches crop growth, such as through a change in timing, variable rate application, or the use of models. Fertilizer management can reduce costs, improve farm resilience, and provide a range of co-benefits for the farm, its region, and the planet. If you think that any of these practices might be applicable to your farm, please contact your local extension office or farm service provider for further assistance.
Footnotes
- The average rate of inorganic N fertilizer in NYS for corn is 92 kg N /ha/yr but this does not include use of manure as a fertilizer [5, Appendix A]. This equals 81 lbs N /ac/yr.
- The production of nitrogen fertilizers in the U.S. requires approximately 13,500 BTUs per pound of nitrogen, and 13,500 BTUs/lb N x 81 lbs N/ac/yr = 1,093,500 BTUs/ac/yr from applied N. The average household in the Northeast consumed 94,000 BTUs of energy in 2015, and 1,093,500 BTUs/ac/yr- ÷ 94,000 BTUs/household/yr = 12 households/ac.
- In the example given, inorganic nitrogen was 13 lbs N/1,000 gal and organic was 7.2 lbs N/1,000 gal. With 10,000 gal/acre applied, that would give 130 lbs N/acre and 72 lbs N/acre respectively. Manure levels of N and application rates vary.
- From Welch et al. 1971. Corn yields with fall, spring, and sidedress nitrogen. Agronomy Journal, Vol. 63. Figs. 1-4 show maximum fall yield using 224 kg N/ha obtained in spring with 112 kg N/ha at one location, same amount used in other three locations.
- From page 11 of Appendix F in the FAST-GHG documentation. Pre-plant plus side-dress management can reduce N rate by 70 kg N ha-1 compared to a pre-plant only rate of 180 kg N ha-1. (70 ÷ 180) 100 = 39%

